Then on February 27th, When gold was bouncing off a seeming near-term bottom and many analyst where again filled with risk-on enthusiasm for the precious metal, I suggested that regardless of price level, a more prudent time to enter gold was closer to the end of June. See "Gold Chart: Price May Be Right, But Is Timing?"
On May 20th I also put out a third article on gold titled, "Gold Charts: Warning In February Still Valid Today" in which I warned that this year's seasonal down-pressure was still likely not over. The wisdom of February's article had become fully apparent by then, with gold prices down another 20%, and the GLD near $131.
In my May article I reiterated the importance of patiently waiting for the end of June to find a positive risk-reward re-entry time-point for gold. Another final leg down was forecast. As it ended up, it would have been hard for me to have been more correct, with gold falling further in June to a closing low on the GLD the week of June 27TH below $116.
This first half of 2013 did in fact prove to be an historic sell-off in gold prices. My model then indicated a strong buy signal on June 27TH, the week it was forecasted due in, which I had also published at my website, GOLDPIVOTS.com.
FUNDAMENTALS SUPPORTING GOLD THIS WEEK
This week the GLD has risen from its June's lows to a high just above $129.50, and as in previous quarters, now may be time to look at gold's favorable fundamentals.
1. The timeliness of annual seasonality coming in for gold prices. August is often a key month for gold.
2. Unemployment remains a chronic and unresolved problem, with an uncertain outlook, which is often a positive for gold prices.
3. Federal Reserve tapering issues still remain on-again off-again blurry, and a continuing dovish Fed monetary posture regardless remains likely, also positive for gold.
4. Chinese gold buying remains strong (even though some headlines may suggest otherwise) with China likely becoming the largest gold purchaser in the world on an annual basis this year.
5. Gold Mining stocks have also begun to rebound, which may be an indicator of better production cost to expected metals price ratios (which also makes miners particularly interesting as an alternate gold investment). The NUGT ETF this month is outperforming.
6. And gold is still considered a viable hedge by some analyst against a correction in stock prices (which some analysts are anticipating sometime this fall, if not sooner).
A LOOK AT THE CHARTS
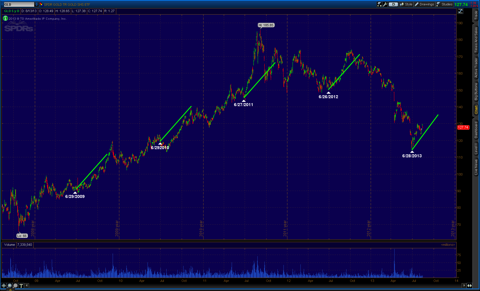
The following chart updates my chart from February of the GLD ETF illustrating how waiting until about the beginning of July has been a very good annual risk-on risk-management strategy for gold since July 2009.
(Right click on the image of the chart to open in new tab. Left click on the image opened in the new tab to further zoom EchoVector Analysis chart image illustrations and highlights.)

(Click to enlarge)
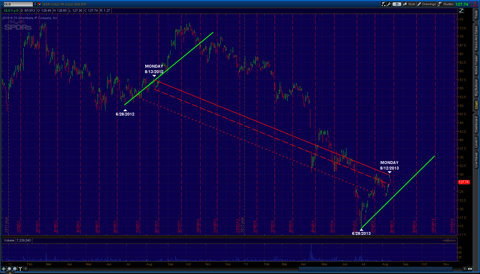
Now, this week is particularly important for the gold metals going forward into August's primary option expiration, and also going forward into the three week's thereafter, from an EchoVector Analysis Perspective. Last year, the three weeks that followed options expiration proved particularly strong on relative price strength basis within an annual echovector perspective.
Zooming into this perspective on the chart below, we see (highlighted in red) the currently active annual echovector running to this week's current high on Monday from its coordinate echo-back-week high on the corresponding Monday one year ago. We also see this year's coordinate green extension vector (symmetrical to the prior four years) leaves prices additional room to rise from current levels -- a rise to the $135 price level on the GLD, before reaching parity. If prices hold up this week going into expiration, this may indicate gold might be staging for a nice price lift in the following weeks that could last well into mid-September.
(Right click on the image of the chart to open in new tab. Left click on the image opened in the new tab to further zoom EchoVector Analysis chart image illustrations and highlights.)

(Click to enlarge)
ADDITIONAL ANALYSIS
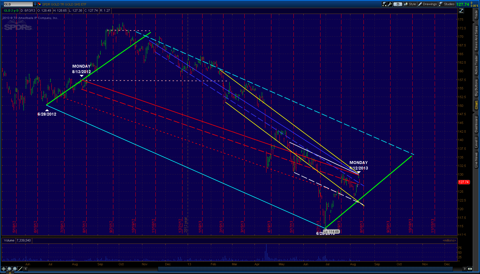
If gold does not hold up the next few day's going into expiration, or shows little or no following lift next week, we could see the annual echovector start to pivot downward again with gold potentially revisiting its summer lows in the near term. Keeping a close eye on this time-period, as well as the impacts of the quarterly echovector, the bi-quarterly echovector, the tri-quarterly echovector this week and next could help signal early gold's price bias and movement on into fall. In the chart below each of these key echovectors is highlighted. Notice the relatively strong downward momentums each of these three shorter term echovectors presents. The quarterly echovector is highlighted in solid white, the bi-quarterly echovector is highlighted in solid yellow and the tri-quarterly echovector is highlighted in solid blue-purple. Each of their currently corresponding near-term August option's expiration low coordinate forecast echovectors are highlighted in the respective spaced-color equivalent.
(Right click on the image of the chart to open in new tab. Left click on the image opened in the new tab to further zoom EchoVector Analysis chart image illustrations and highlights.)

(Click to enlarge)
If gold's price stays above the red-spaced annual coordinate forecast echovector going into options expiration and for the several days thereafter, each of these shorter-term echovectors will begin to pivot upward. This could add additional bullishness to gold prices going into the following weeks, and strengthen potential price level gains from any annual seasonality that may be in effect. Traders and investors will want to focus on these dynamic echovector perspectives in the few days ahead. This potential added bullish scenario would be a very positive technical outcome for gold prices in the near-term.
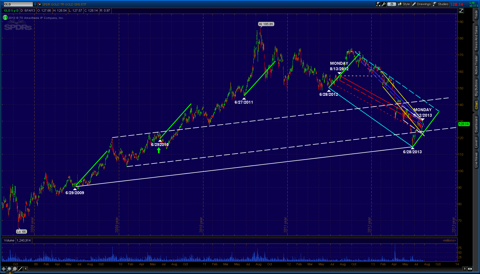
It currently appears that the risk-reward ratio to any risk-on position may begin to increase dramatically the week of primary options expiration in September on an annual echovector perspective basis. However the longer-term 4-year presidential cycle echovector, coupled with this potentially positive short-term scenario, could propel prices higher beyond September. This is illustrated in the following chart.
(Right click on the image of the chart to open in new tab. Left click on the image opened in the new tab to further zoom EchoVector Analysis chart image illustrations and highlights.)

(Click to enlarge)
Will the price of gold start to shine again soon, and gold break out above the $130 level, setting this potential bullish scenario in motion? Fundamental arguments have been presented by many analyst for this possibility the last several weeks, and crucial technical support for this possibility may also be forming this week as presented in this extended analysis. How to measure and interpret the next several days of trading price action has also been discussed. And the possible ramifications to gold's outlook this fall, and into the remainder of the year have been discussed. This is an important week in gold. So now may be a very good time to re-assess gold's near-term attractiveness and its eventual longer term potential standing within your portfolio.
Thanks for reading.


No comments:
Post a Comment